
Fact Concepts
A Fact table holds rows of data containing the measures/numbers you wish to analysis. For example, a Sales fact table contains one row per invoice line item with sale amounts, discounts and other measures. A Fact table represents a business process or a Business event.
Business Events can can be classified in to 3 types:
- Discrete
- Evolving
- Recurring
Discrete Business Events = Transaction Fact Tables
Discrete Events are “point in time” events, usually of short duration. They are typically atomic-level transactional events.
Examples include:
- The customer buys a product in the store.
- Employee sends a marketing email.
Discrete events are completed at the moment they occur, or shortly after. Discrete events are generally associated with a single data and time.
Discrete Events are represented as Transaction Fact tables in the Data Warehouse.
A transaction Fact represents a discrete business event. It is often identified as a single record within a source database. It could be part of a larger business process, but this one event within the process generates its own record in the source database. Some example include
- An in-store purchase.
- A metering application, that captures a part passing through a station in an assembly line
- A visit to a website.
Rows in transaction facts shouldn’t change. In theory the row should be immutable. There may be an additional transactions that modify or cancel a previous transaction, but each transaction should not change. However in reality there are often exceptions to that rule. History of a transaction can be captured using a ledger based approach where new versions of the fact are written to the fact table superseding older versions. This requires careful handling in both the ETL and any client that consumes the data (including Cubes and Column stores).
Within the course materials is a Data Warehouse database. The fact_TimeRecord fact is an example of a transaction Fact. The fact represent the event: Employee records worked Hours for Day.
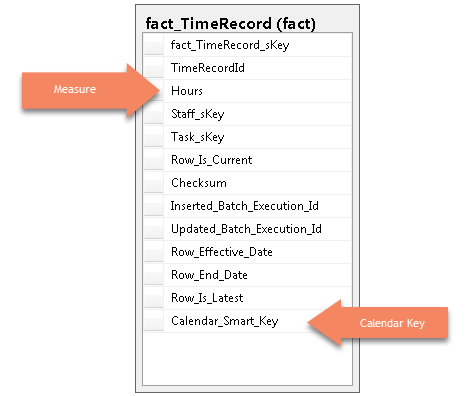
Notice that the fact table only has a single relationship to a Calendar Dimension.
Below is a query run against the example TimeRecord fact. This query returns the total hours, aggregated at service name level for staff with a service role = ‘Service Delivery’ removing any Time Records where service name is NULL.
SELECT ServiceTypeName, SUM([Hours])
FROM fact.fact_TimeRecord f
JOIN dim.dim_Staff s
ON f.Staff_sKey = s.Staff_sKey
AND s.ServiceRole = 'Service Delivery'
JOIN [dim].[dim_Task] t
ON f.Task_sKey = t.Task_sKey
AND ServiceTypeName is not NULL
GROUP BY ServiceTypeName
[/code]
Evolving Business Events = Accumulating Snapshot Fact
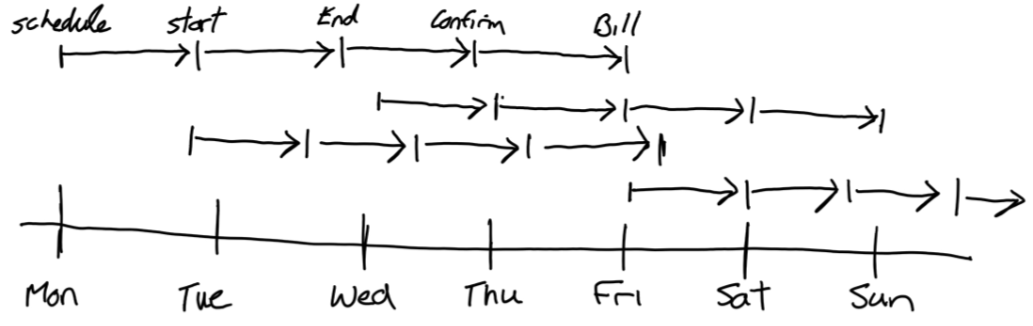
Evolving events are long running business processes. They are often a series of related discrete events.
Examples include:
- Purchasing: Requisition, Purchase order, Vendor Invoice, Delivery, Payment.
- Home Care Visit: Scheduled, Started, Finished, Confirmed, Billed.
Evolving events are typically associated with multiple dates and times, one per discrete event in the series of related discrete events.
Evolving Events are modeled as accumulating snapshot Fact tables.
An accumulating snapshot fact captures multiple events of business process within the one fact table. Usually the events represent an entity proceeding through a series of know statuses. For example, a work item could go from proposed, to approved, to in progress, to complete. Each event has its own timestamp. Accumulating snapshot fact measures usually include the duration it takes to move between each event of the process and other measures of each event. Usually each events of the process involves updating a single existing record in the source system. The history of the fact is captured by updating the timestamp on which the fact changes to each status within a single row.
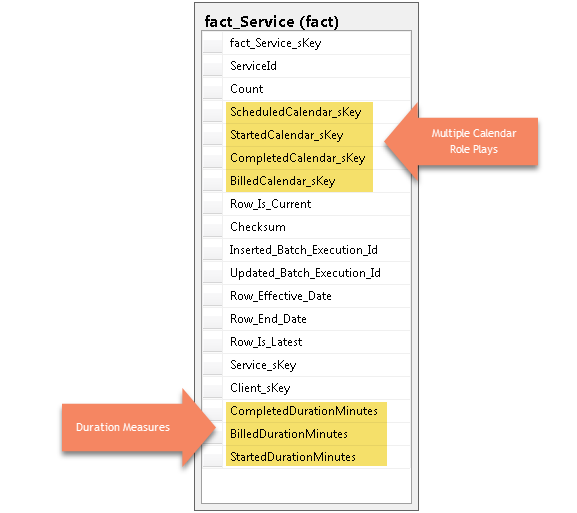
Within the course materials is a Data Warehouse database. The fact_Service fact is an example of a Accumulating Snapshot Fact. The fact represent Service delivery business process through its various events.
Accumulating Snapshot tables are useful answering question like “How many X proceeded through status Y in a Calendar period”. E.g.
- “How many Services were started in July”,
- or “How many Services were scheduled to start in June but actually started in July”. This question is particularly relevant. You could model Service Scheduled, Service Started, Service Complete etc as separate transaction fact tables. But if you did you couldn’t answer this question, well… not without joining Fact tables, which is generally regarded as poor practice. In addition, it would be difficult to do this as a calculated measure in a Cube, and the performance would be poor. If you are analyzing a Services business Accumulate Snapshots are important.
- or “What was the Average Duration of Domestic Assistant Services Completed in June, July, August, Sept and October” i.e. a trend.
One of the characteristics of an Accumulating Snapshot fact is that it is associated with several role plays on the Calendar Dimension, and/or Time Dimension. Calendar and Time should be separate Dimensions. This can make it difficult to navigate for business users. In a Cube, the solution is to hide all the Role play Calendar Dimensions except the dis-associated regular Calendar Dimension. Then use LinkMember MDX along with the Role play calendar and target measure to define calculated measure like “Started Count”, “Completed Count”, “Scheduled Count”. Business Users can use the one Calendar Dimension, rather than having to decide which role play Calendar Dimension to use with a generic Count measure to get the right result.
Accumulating snapshots tend to change often as the events “accumulate” for a process until it is complete. You would typically see a lot of updates for this type of fact.
Below are queries you can run against the example Service fact. They correspond to the questions posed above.
/****************************************************************
This query represents "How many Services were started in July"

Uses the Started Calendar

*****************************************************************/

Select COUNT([Count]) AS [Count of Services Started]
FROM fact.fact_Service f
JOIN dim.dim_Calendar c
ON c.Calendar_Smart_Key = f.StartedCalendar_sKey
AND Mth_Label = 'Jul 2014'

/*******************************************************************************
"How many Services were scheduled to start in June but actually started in July"

Uses both Started and Scheduled Calendar

********************************************************************************/

Select COUNT([Count]) AS [Count of Services Started]
FROM fact.fact_Service f
JOIN dim.dim_Calendar c
ON c.Calendar_Smart_Key = f.StartedCalendar_sKey
AND c.Mth_Label = 'Jul 2014'
JOIN dim.dim_Calendar sch
ON sch.Calendar_Smart_Key = f.ScheduledCalendar_sKey
AND sch.Mth_Label = 'Jun 2014'

/***************************************************************************************************************
"What was the Average Duration of Domestic Assistant Services Completed in June, July, August, Sept and October"

Uses Completed calendar to get Services completed in each month.

****************************************************************************************************************/

Select Mth_Label, SUM([CompletedDurationMinutes])/COUNT([Count])/60 Avg_Completed_Duration_Hours
FROM fact.fact_Service f
JOIN dim.dim_Calendar c
ON c.Calendar_Smart_Key = f.CompletedCalendar_sKey
WHERE c.Mth_Label IN('Jun 2014', 'Jul 2014','Aug 2014', 'Sep 2014','Oct 2014')
GROUP BY Mth_Label
[/code]
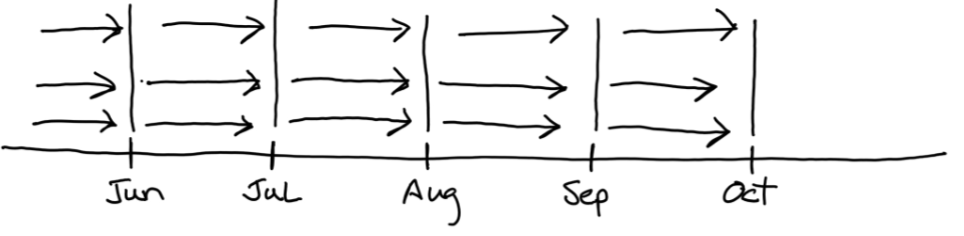
Recurring Business Events = Periodic Snapshot Fact
Recurring Events are period measurements that occur at predictable intervals, such as daily, weekly, monthly etc.
Examples include:
- Balance Sheet. Financial Account Balances.
- Nightly Balance for Bank Accounts.
Recurring events are typically used to sample and summarize discrete events, especially where cumulative measures are required. Balances are stored because deriving the balance from the start of time by summing all discrete events for an account is expensive.
Recurring Events are modeled as periodic snapshot Fact tables.
A periodic snapshot fact captures the aggregate or balance of a business process or event for a given period. Common examples are monthly financial account balances, monthly bank account balances etc. Periodic Snapshot fact tables are usually built from the data contained in a transaction fact table. They start with an opening balance (from the previous period) tally up the transactions for the current period and produce a closing balance. However periodic snapshot fact tables may also represent aggregations (SUM, AVG etc) of a period. For example, at the end of each day, the rolling 12 month sum of Asset failure minutes. The fact is a historical snapshot as at a point in time.
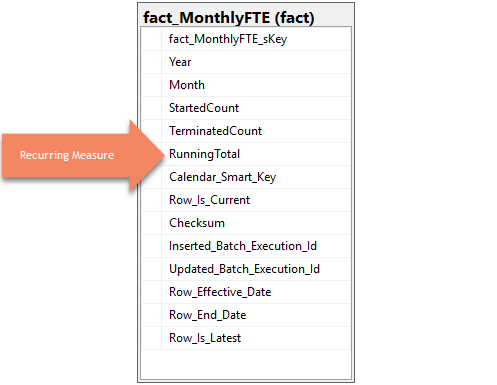
Below is a query run against the example Monthly FTE fact. This query returns the head count trend over a 5 month period.
/**********************************************************

Monthly FTE Trend

***********************************************************/
Select Mth_Label, [RunningTotal]
FROM [fact].[fact_MonthlyFTE] f
JOIN dim.dim_Calendar c
ON c.Calendar_Smart_Key = f.[Calendar_Smart_Key]
WHERE c.Mth_Label IN('Jun 2007', 'Jul 2007','Aug 2007', 'Sep 2007','Oct 2007')
ORDER BY c.Month_Begin_Calendar_Key
[/code]
Query from Multiple Facts
When joining across facts, you need to be careful. Lets say you wanted to see the average hours for services completed in July 2014. To calculate this you need to get the count of completed services in July 2014 from the Service Fact and Total Hours for July 2014 in the Time Record Fact. The queries below demonstrate how to correctly join across facts.
/*******************************************************************

Cross Fact Query

*******************************************************************/

-- Returns Hours = 125.58, Count = 111, Avg_Hours = 1.131351
SELECT SUM([Hours]), COUNT([Count]) ,SUM([Hours])/COUNT([Count]) Avg_Hours
FROM fact.fact_TimeRecord f
JOIN dim.dim_Calendar c
ON c.Calendar_Smart_Key = f.[Calendar_Smart_Key]
JOIN fact.fact_Service sf
ON c.Calendar_Smart_Key = sf.[CompletedCalendar_sKey]
WHERE c.Mth_Label = 'Jul 2014'

-- But wait! Run these measures individually and you get
-- Returns Hours = 151.58
SELECT SUM([Hours])
FROM fact.fact_TimeRecord f
JOIN dim.dim_Calendar c
ON c.Calendar_Smart_Key = f.[Calendar_Smart_Key]
AND c.Mth_Label = 'Jul 2014'

-- Returns Count = 23
Select COUNT([Count]) AS [Count of Services Completed]
FROM fact.fact_Service f
JOIN dim.dim_Calendar c
ON c.Calendar_Smart_Key = f.CompletedCalendar_sKey
AND Mth_Label = 'Jul 2014'

-- You can't Join over Facts in this way. What is missing is a join between the facts.
-- Instead you need aggregate measures for each fact first as sub-queries filtering on the same
-- dimensions and then join the sub-queries back together by the dimension attributes. E.g.

-- Returns Hours = 151.58, Count = 23, Avg_Hours = 6.590434
Select [Hours], [Count of Services Completed]
,[Hours]/[Count of Services Completed] Avg_Hours
FROM
(
-- aggregate hours
SELECT Mth_Label, SUM([Hours]) [Hours]
FROM fact.fact_TimeRecord f
JOIN dim.dim_Calendar c
ON c.Calendar_Smart_Key = f.[Calendar_Smart_Key]
WHERE c.Mth_Label = 'Jul 2014'
GROUP BY Mth_Label
) H
JOIN
(
-- aggregate service count
Select Mth_Label, COUNT([Count]) AS [Count of Services Completed]
FROM fact.fact_Service f
JOIN dim.dim_Calendar c
ON c.Calendar_Smart_Key = f.CompletedCalendar_sKey
AND Mth_Label = 'Jul 2014'
GROUP BY Mth_Label
) C
--join across dimensions
ON H.Mth_Label = C.Mth_Label
[/code]
Advice
The query examples demonstrate that querying dimensional models can be easier than, say, querying an operational database, but they also demonstrate that beyond simply queries, the syntax can get complex, especially if you query from multiple fact tables. Our advice is to include a Semantic layer in your solution. A semantic layer will (in concept at least) generate all these queries for you, as you drag and drop measures and attributes into a pivot table/chart. There is no need to understand joins, aggregate, group by and sub queries.