What is a Fact table? (and why you need them)
In the context of a data warehouse, a fact table represents a business process or event and contains the measures and metrics you want to analyze for that process or event. There are three types of facts corresponding to three kinds of business events.
A Fact doesn’t exist in isolation. It is related to a set of Dimensions. The Dimensions represent the business entities involved in the business process or event. The Who, What, Where, When and Why of the business event. Dimensions provide context about the Fact.
Below is a diagram depicting an example “Job” Fact and its related dimensions – Customer, Calendar (i.e. Date), Time of Day, Employee and Address. It models a business event where Employees are sent on “Jobs” to mow lawns. Each Job is a business event and, therefore, can be modelled as a “Job” Fact.
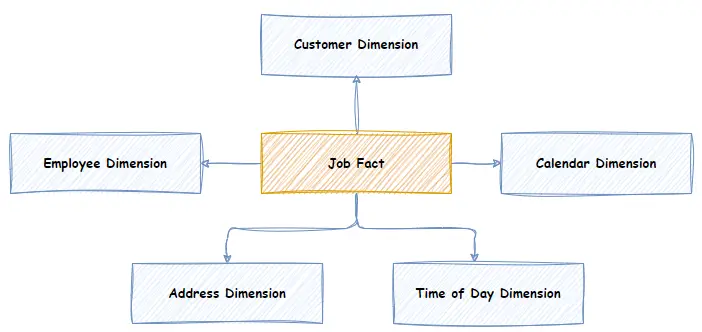
The Job Fact table contains the measures related to the Job. For example:
- The $ cost of the job (e.g. $200.00)
- The duration of the job (e.g. 1.5 Hrs)
- The sq meters of the job (e.g. 200 sqm)
Measures, also known as metrics, are numerical values that can be aggregated; meaning they can be summed, averaged, or subjected to other mathematical operations. However, some measures are only semi-aggregable or non-aggregable. You can read further about measure additivity in the “three types of measures”.
A Fact table also contains a primary key (in this case, a “Job Id”) and the foreign keys to its dimensions. You can learn more in the schema of a fact table section.
A fact table works with its related Dimensions to support ad hoc analysis, reporting, and dashboards. For example, perhaps you want to know the average cost per sq meter for Pensioners. First, you select all jobs where the associated Customer has a Pensioner Status = true. Then, you apply a formula over the result set of fact rows to calculate the average cost per square meter—in this case, “sum(cost of job)/sum(sq meters).”
Why do you need Fact tables?
Fact tables are one element of a simple but powerful data modelling technique called dimensional modelling. Dimensional modeling focuses on delivering simplicity for the end user. It allows users to easily understand and navigate the data available for reporting and ad hoc analysis. A dimensional model supports high-performance aggregated queries and supports many different analytics use cases.
The 3 Types of Fact Tables
There are 3 types of fact tables.
- Transaction Fact table
- Accumulating Snapshot Fact table
- Periodic Snapshot Fact Table
The 3 types are derived from the 3 types of business events:
- Discrete business event (transaction fact)
- Evolving business event (accumulating snapshot fact)
- Recurring or Periodic business event (periodic snapshot fact)
Each type of fact event/process is modelled differently.
Transaction Fact Tables (Discrete Business Events)
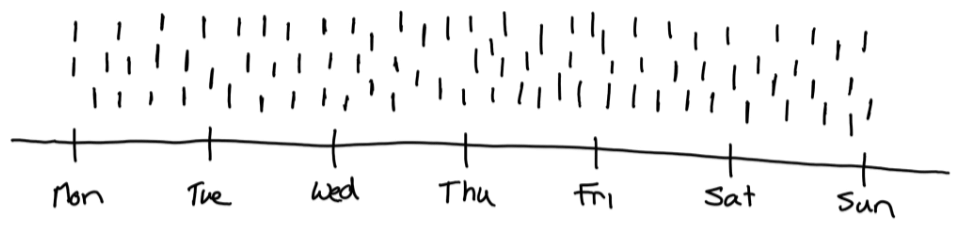
A transaction fact table is used to model discrete business events. Discrete events are “point in time” events, usually of short duration. They are typically atomic-level transactional events.
Examples include:
- The customer buys a product.
- A marketing email is sent.
- A meter reading.
- A visit to a website.
Discrete events are completed at the moment they occur, or shortly after. Discrete events are generally associated with a single date and time.
Discrete Events are represented as Transaction Fact tables in the Data Warehouse.
A transaction Fact represents a discrete business event. It is often identified as a single record within a source database. It could be part of a larger business process, but this one event within the process generates its own record in the source database.
Accumulating Snapshot Fact Table (Evolving Business Events)
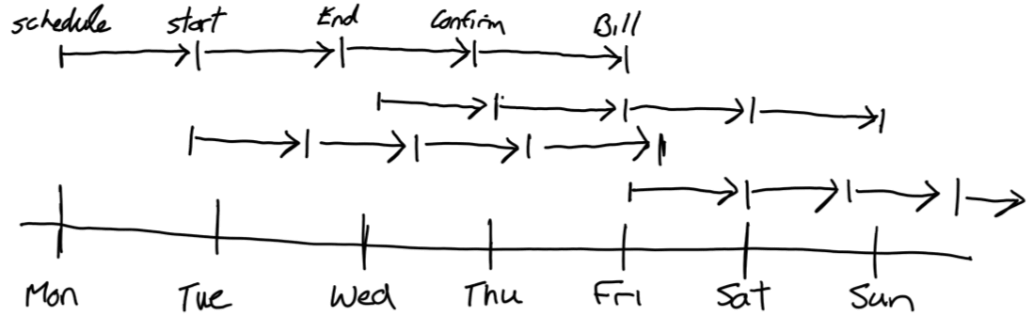
Evolving events are long-running business processes. They are often a series of related discrete events.
Examples include:
- Purchasing: Requisition, Purchase order, Vendor Invoice, Delivery, Payment.
- Home Care Visit: Scheduled, Started, Finished, Confirmed, Billed.
- Mowing Job. Booked, Scheduled, Started, Completed.
Evolving events are typically associated with multiple dates and times, one per discrete event in the series of related discrete events.
Evolving Events are modelled as accumulating snapshot Fact tables.
An accumulating snapshot fact captures multiple business process events within the one fact table. Usually, the events represent an entity proceeding through a series of known statuses. For example, a work item could go from proposed, to approved, to in progress, and complete. Each event has its own timestamp. Accumulating snapshot fact measures usually include the duration it takes to move between each event of the process and other measures of each event. Usually, each event of the process involves updating a single existing record in the source system. The history of the fact is captured by updating the timestamp on which the fact changes to each status within a single row.
Periodic Snapshot Fact Table (Recurring Business Events)
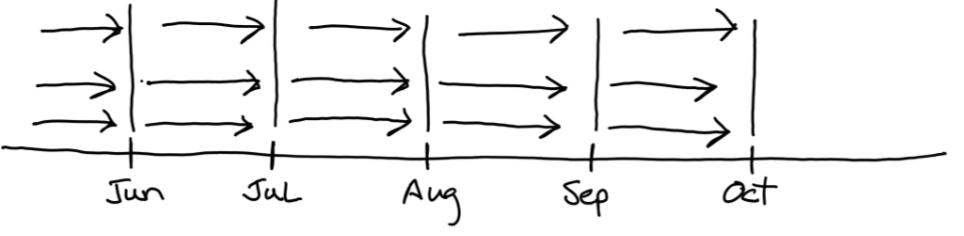
Recurring Events are period measurements that occur at predictable intervals, such as daily, weekly, monthly, etc.
Examples include:
- Balance Sheet. Financial Account Balances.
- Nightly Balance for Bank Accounts.
Recurring events are typically used to sample and summarize discrete events, especially where cumulative measures are required. Balances are stored because deriving the balance from the start of time by summing all discrete events for an account is expensive.
Recurring Events are modeled as periodic snapshot Fact tables.
A periodic snapshot fact captures the aggregate or balance of a business process or event for a given period. Common examples are monthly financial account balances, monthly bank account balances, etc. Periodic Snapshot fact tables are usually built from the data contained in a transaction fact table. They start with an opening balance (from the previous period) tally up the transactions for the current period and produce a closing balance. However, periodic snapshot fact tables may also represent aggregations (SUM, AVG, etc) of a period. For example, at the end of each day, the rolling 12-month sum of Asset failure minutes. The fact is a historical snapshot at a point in time.
Factless Fact Table
Okay, Okay. I know I said there were 3 types, but this is the exception to the rule! A factless table is designed to simply acknowledge the existence of a relationship between 2 or more dimensions. There is no business event.
A good example can be found in companies that manage electrical assets. The poles and wires that deliver electricity to houses. Imagine you wanted to count the number of assets of a particular type that exist within a region. An Asset factless Fact table with relationships to an Asset and Region dimensions would serve this purpose.
Why is it called a factless fact table? An “eventless” fact table would be a better description since no event needs to occur to record the existence of the relationship. Another description might be a “measureless” fact table since factless fact tables are assumed to have no measures. But even that is a misnomer. A factless fact table does, in fact, have a single measure: a “count” measure. I think the confusion arises because it’s not necessary to explicitly put a count measure column on a fact table to be able to count rows. As a rule, I always explicitly add a count measure column, with a value of 1 in every row. It makes it clearer why the factless fact table exists, and makes it easy to create the count measure in a semantic layer.
Is a factless fact table a “design smell”? Not exactly, but it could indicate you haven’t considered the nature of the “exists” relationship. Especially if you throw in Calendar/Time as a dimension. When does the relationship exist? When did the relationship start to exist, and when did it cease? This thinking can often lead you to build an accumulating snapshot fact table. In our Asset example, consider the lifecycle of the Asset. It’s planned, constructed, enters operation, and retired. All of these events occur at a point in time. If you created an accumulating snapshot fact that matched the business process, you can still answer the original question, “Count the number of assets of a particular type that exist within a region”, but it also adds the ability to enhance that question to “Count the number of operational assets of a particular type that existed within a region at the end of FY 26“, which is probably a more accurate request, that better matches the users intent.
Facts vs Dimension table
Facts and dimensions serve different purposes but work in concert to support reporting and analytics.
As discussed previously, a Fact table represents a business process or event. It contains the measures/numbers you want to analyze, whereas Dimensions are a business entity related to the business event the Fact represents. A business entity is the people, places, and things that perform a business process or event.
The Fact only contains the measures (e.g., $, quantity, count, duration, etc.) related to the business event and foreign keys to the related dimensions. The Dimensions contain the context/qualitative attributes of the related business entities. For example, a Customer dimension might have attributes like Name, Gender, Pensioner Status, Has a Dog, etc.
Facts and Dimensions exist together in a star schema. When analysts use the star schema to answer a business question, they filter the facts by selected dimensional attributes. E.g. “Select Facts related to Customers where HasADog = ‘true'”, then aggregates a measure to produce a value E.g. “Select AVG(duration) From Facts related to Customers where HasADog = ‘true'”
The schema of a fact table
A Fact table contains four types of columns:
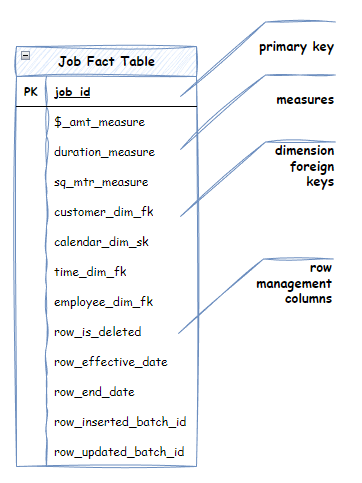
- Measures. Measures are the “numbers” or metrics by which you “measure” your business process/event. Typically, a measure is an amount, count, $ value, duration, area, length, ratio, etc. A measure is always numeric. A fact table can have multiple measures.
- Foreign Keys to Dimensions. Facts contain a foreign key to each Dimension associated with the Fact. Typically, the relationship is with the surrogate key of the dimension. These foreign keys are the “link” that allows Fact tables to be filtered by the attributes of the Dimensions.
- Primary Key. The primary key is the unique key used by the source of the Fact to identify a unique instance of the business event. E.g. job_id in the source Job management system. A primary key can be a composite key. A primary key is important. The ETL process uses it to determine if it needs to insert or update a row. There should be only one row in the fact per primary key. See the “Fact table grain” for more details.
- Management Columns. Management columns are used by the ETL process and occasionally at query time. They provide metadata about the row. Examples include effective dates, deleted indicators, latest indicators, and batch load IDs.
A Fact is designed to be “narrow and long” versus dimensions which are typically “short and wide”. A fact table could contain billions of rows (i.e. long). It’s desirable to store as few columns as possible (i.e. narrow) to aid performance. The contextual information (which is generally substantial) is offloaded to the “short and wide” dimensions. Dimensions typically contain fewer rows (they are not generally transactional in nature) but contain many columns representing all the attributes of the business entity they represent.
Typically, end users only see the measures via a semantic layer. The other columns are hidden. They are only required by the ETL process or the underlying semantic model and query engine.
The 3 types of measures on a Fact table
Additivity is a crucial concept when discussing measures. In general, analytical queries retrieve thousands or millions of rows. Once retrieved the measures are aggregated in some way. The default aggregation of most semantic and BI tools is to add, or in other words, sum the values.
- Additive. A measure is additive if it can be summed across any combination of dimensions to produce a sensible result. For example, imagine a sales fact with a sales_amount measure. A user can use any combination of dimension attributes to filter the fact rows and still sum the sales amount to get total sales.
- Semi-additive. Semiadditive measures can be added only along some of the dimensions. Usually semiadditive measures can’t be added across the calendar/date dimension. This is especially true for period snapshot fact tables. For example imagine a Monthly Inventory period snapshot fact with an end_of_month_product_balance measure. For a given month, you can add the balances of different products to get a total balance for a Product Category (an attribute of a Product Dimension). However, you can’t add the end_of_month_product_balance product balance for January + February + March (Month attribute from the Calendar/Date Dimension) to produce an end_of_quarter_balance. This doesn’t make sense. Instead you need to use a different aggregation (e.g. Count, MAX, MIN or AVG) over the Calendar/Date Dimension after summing across all other dimensions.
- Non-additive. Non-additive measures can’t be added at all. Nonadditive measures must use a different aggregation (e.g. Count, MAX, MIN, but not AVG) over all dimensions. Measures that are percentages and ratios, such as gross margin, are always nonadditive. Percentages and ratios cannot be averaged either. Instead of storing nonadditive measures in the fact table, it is better to store the numerator and denominator. The ratio can be calculated in the semantic layer or reporting tool later. When calculating the ratio, ensure you calculate the “ratio of the sums”, not the “sum of the ratios”.
A good example is unit_price. unit_price is the ratio sale_amt/units_sold. See the image below of analysis of 12 sales of a given product.
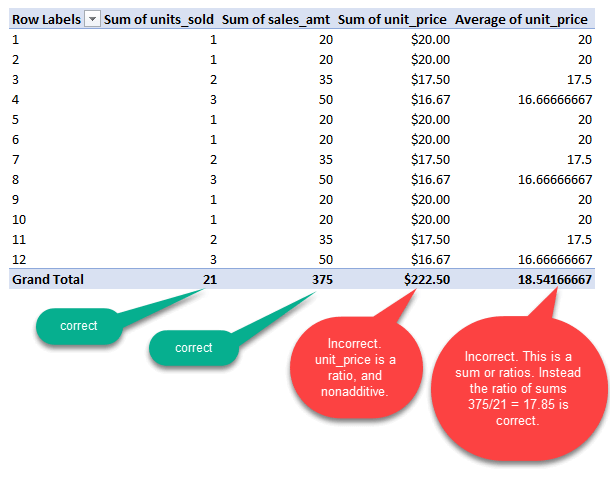
Summing unit price across any of the dimensions results in a nonsense number. Therefore it is nonadditive. Averaging unit_price results in an incorrect value because you are “summing the ratios” instead of the “ratio of the sums”. In order to analyze the average unit_price for a product, you do the “ratio of the sums”, which is sum( sales_amt)/sum(units_sold). The MIN or MAX unit_price is a valid aggregation.
A fact can contain a mix of additive, semi-additive and non-additive measures. For example, imagine the inventory fact discussed. It could have the additive measure total_units_sold, the semi-additive measure end_of_month_product_balance, and the non-additive measure avg_unit_price.
Understanding Fact Table grain
The “grain” of a fact table describes the lowest level of detail available in the fact table. It provides the answer to the question, “How do you describe a single row in the fact table?” The atomic level of a fact table aligns with its primary key.
In the case of a transaction fact table. the preference is to store data at the most atomic level captured by a business process. Atomic data is the most detailed information available.
Examples of the grain of transaction facts are:
- An individual line item on a retail sales receipt. The primary key is sales_id and line item number.
- An individual product produced. The primary key is a product serial number.
- An individual mowing job is done. The primary key is the job_id.
Period snapshot facts have a grain that includes a snapshot business process and a calendar interval. For example:
- A daily snapshot of the inventory levels for each product in a warehouse. The primary key is product and day.
- A monthly balance for each bank account. The primary key is the account and month.
All measures on a Fact table share the same grain. If a measure exists at a different grain, you need another fact.
There is a misconception that the grain of a fact aligns with the intersection of all its dimensions. This isn’t true. It’s typical for a fact to exist that doesn’t yet have all of its possible dimensions. Instead, it is the atomic level of detail of the underlying business process.
There is also a misconception that dimensional models should only contain summarized data. This mistake invites the criticism that the dimensional model needs to anticipate the business questions at various grains. Fact tables with grains that represent a higher aggregation of the most atomic data are limited to fewer and less detailed dimensions. Less granular facts inevitably run into issues when users try to drill down into details.
In contrast, an atomic fact offers the utmost analytical flexibility. It can be filtered and aggregated in every conceivable manner, across detailed dimensions, at all levels of granularity. Atomic data within a dimensional model can accommodate a variety of unforeseen use cases and ad-hoc analyses.
And don’t forget, you can have more than 1 fact table! It’s typical for a data warehouse to have more than one type of fact for the same business process. Typically, you would couple a transaction or Accumulating Snapshot fact with a periodic snapshot fact.
For example:
- An inventory transaction fact. I.e. Add to inventory and take from inventory transactions.
- A monthly periodic snapshot of inventory balances.
Why have different types of facts for the same business process? Because each one can answer different questions.
Don’t try to mix grains to fit into a single fact. An example where people make this mistake is a sales fact. Certain measures exist at the line item level, e.g. num_of_units and $ amount. Other measures only exist at the Sale level, like discount_given, and sales_tax. You could try apportioning the discount to the line item level, but a better and easier approach is having 2 facts. A fact at the sale grain and a fact at the sale_line_item grain. You use conformed dimensions to allow analysis across these two facts, but that’s a story for a different article.