
A semantic layer for your Data Warehouse
This section is an introduction to the Semantic layer. People build careers on implementing only this layer. It’s a big subject, and this article will give you an overview of what the semantic layer is, why it’s important, how it is modelled, and how it works.
“A semantic layer is a business representation of corporate data that helps end users access data autonomously using common business terms. A semantic layer maps complex data into familiar business terms such as product, customer, or revenue to offer a unified, consolidated view of data across the organization.” – Wikipedia.
A semantic layer exists to:
- Enhance the information in the Data Warehouse, making it more useful for the business.
- Make querying a Data Warehouse much easier.
- Improve aggregated query performance.
The semantic layer:
- Sources data from the Data Warehouse. It can source data from other data stores, but the Data Warehouse is specifically modeled as a star schema to support the semantic layer.
- Enhances the data by adding Hierarchies, Calculated Measures, and Calculated Members.
- Can unify data from multiple sources, I.e. Data Marts.
- Provide a high-performance aggregated query engine.
- Provides an interface that BI tools use to enable ad-hoc analysis with Drag and Drop. The Semantic layer is the layer/data store that BI tools usually connect to.
Semantic layers come in 2 flavors:
- Virtual. The virtual semantic layer doesn’t store a separate copy of the data (although it might cache data). Business Objects Universe is an example of this. I believe this flavour will become more prevalent as the processing power of Relational and Big Data platforms improves. Unless the Data Warehouse is utilizing advanced technology like column stores and MPP, then it’s likely the queries won’t execute as quickly as the Datastore flavour below.
- Data Store. Technologies like Microsoft Analysis Services Multi-Dimensional and Tabular models and PowerBI data sets fit in this category. They contain a completely new copy of the Data. The Datastore flavour tends to perform better than the Virtual flavour because these data stores are structured to support high-performance aggregated queries. The emphasis is on aggregated. It’s worth noting that all of these technologies can also operate in a “Virtual” configuration. The data store is usually transient, re-loaded on a periodic basis from the Data Warehouse.
For further information on the Semantic layer, take a look at What is a Semantic Layer? What, Why, How and More…
Modelling a Semantic Layer
A Semantic layer should be modelled as a Star Schema. Indeed, in some technologies (like Cubes), there isn’t a choice. The base underlying model of your semantic layer should map directly to the Facts and Dimensions in your Data Warehouse or a subset of the Data Warehouse. If your Data Warehouse is spread over Data Marts, it is possible to bring various Facts and Dimensions from different Data Marts together … as long as you have Conformed Dimensions. This emphasizes the importance of Conformed Dimensions.
The modeler’s job is to enhance the semantic model to provide the Business with an easy-to-use interface. Enhancements include:
- Hiding tables, columns and relationships that are not relevant to the business, like surrogate keys and management columns.
- Renaming tables and columns if necessary (although your data warehouse, if modelled properly, should already be using the correct naming standard).
- Adding hierarchies to Dimensions.
- Adding calculated measures to Facts.
It’s a short list, but there may be many tables, hierarchies and complex measures.
Hierarchies
As discussed in previous lessons, Dimensions can contain natural and parent-child hierarchies. Within the semantic layer, you expose these hierarchies so that users can drill up and down the hierarchy levels in reports. It’s important the underlying Data Warehouse supports these hierarchies and doesn’t violate the 1 to Many relationships. A Hierarchy also simplifies navigation for users. A general rule is if a hierarchy contains an attribute, that attribute should only be visible through the hierarchy and not as another individual attribute. To most business users, a hierarchy just makes sense.
Some Dimensions have multiple hierarchies. A Calendar dimension is a good example of a Dimension with multiple hierarchies, providing various drill paths for different reporting scenarios (I.e. Calendar, Fiscal Calendar, Production Calendar, etc).
Calculated Measures
Calculated measures are implemented in a measure definition language. For the Microsoft data platform, the language for Analysis Services Cubes is MDX, and the language for Tabular models and PowerBI is DAX. You can also execute a DAX measure against a Cube and vice versa. MDX and Cubes are a mature technology with some additional features that are not available in Tabular models. However, the gap is narrowing as Microsoft invests heavily in DAX. In my personal opinion, I like working with Cubes and MDX. The design experience is much more intuitive. Cubes don’t require all data to be loaded into memory and don’t require data loaded into an analysis service instance, just so you can work with it! There is an argument that DAX is easier to understand than MDX. In my experience, that is only marginally true. Easy measures are easy in both, and complex measures are complex in both.
Although there is very little development or investment into OLAP, it’s unlikely that Cubes will disappear any time soon, as there are many Enterprise BI implementations using Analysis Services Cubes. Despite my preference for working with Cubes, my advice is, due to Microsoft’s direction, any new semantic layers are built using Tabular models and DAX.
Below are some examples of MDX and DAX measures for comparison. It is a very small sample of the kinds of things you can do with measures.
Within measures, you can apply Filters, just as if the user was dragging and dropping Dimension Attributes on Rows and Columns:
-
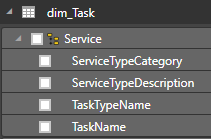
MDX: [Measures].[Cleaning Hours] AS ([dim_Task.[ServiceTypeName].[Cleaning],[Measures].[Hours])
-
DAX: Cleaning Hours:= CALCULATE( SUM ( [Hours] ), dim_Task[ServiceTypeName] = "Cleaning")
You can also do calculations on Measures:
-
MDX: [Measures].[Cleaning Hours Ratio] AS [Measures].[Cleaning Hours] / [Measures].[Hours]
-
DAX: Cleaning Hours Ratio:= [Cleaning Hours]/ SUM( fact_TimeRecord[Hours] )
and you can apply conditional logic:
-
MDX: [Measures].[MinutesRating:] AS IIF([Measures].[SumStartedMinutes] <200000, ,"low","high")
-
DAX: MinutesRating:= IF([SumStartedMinutes]<200000,"low","high")
Measures can also become much more complex. e.g.:
MDX:
[Measures].[Avg Something]
AS AVG({[Category].[Category Set].&[50]}
* descendants([Category].[Category Code].currentmember,[Category].[Category Code].[Category Code])
* {[Lottery].[Lottery Number].currentmember.lag(1):[Lottery].[Lottery Number].currentmember.lag(8)}
, [Measures].[Response - Sale Amt])
/AVG( {[Category].[Category Set].&[50]} * descendants([Category].[Category Code].currentmember,[Category].[Category Code].[Category Code])
 *{[Lottery].[Lottery Number].currentmember.lag(1):[Lottery].[Lottery Number].currentmember.lag(8)}
,SUM([Customer Status].[Status].[All].children - {[Customer Status].[Status].&[Attrite]}
, [Measures].[Customer Balance - Qty]))
DAX:
[A Financial Measure]=CALCULATE (
 SUM ( [CreditLessDebit] ),
 TransactionType[TransactionTypeSubGroup] = "Repayment - Direct Debit",
 TransactionType[IsReversal] = "Transaction",
 'Transaction'[Ghost] = 0
 )
 + CALCULATE (
 SUM ( Reversals[CreditLessDebit] ),
 'Reversals'[Ghost] = 0,
 TransactionType[TransactionTypeSubGroup] = "Repayment - Direct Debit"
 )
 + CALCULATE (
 SUM ( [CreditLessDebit] ),
 TransactionType[TransactionTypeSubGroup] = "Dishonour - Loan",
 TransactionType[IsReversal] = "Transaction",
 'Transaction'[Ghost] = 0
 )
 + CALCULATE (
 SUM ( Reversals[CreditLessDebit] ),
 'Reversals'[Ghost] = 0,
 TransactionType[TransactionTypeSubGroup] = "Dishonour - Loan"
 );
The measure definition language is hierarchy aware. For example, if a user has selected a month in the Calendar dimension, the measure definition language caters for selecting the parent Year of the selected month and providing a calculation for that Year. That is not straightforward in SQL. The below query takes the selected year and returns a measure for the previous year:
MDX: [Measures].[Sales Amt - Same Lottery LY] AS (PARALLELPERIOD([Lottery].[Lottery Year],1,
     [Lottery].[Lottery Year].currentMember ), [Measures].[Response - Sale Amt])
When and How are Measures applied?
Take the following simple pivot table from PowerBI:
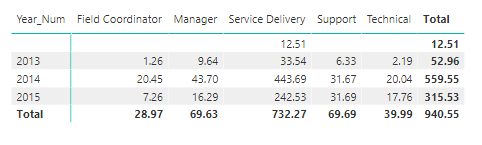
Calendar.Years have been selected on the rows, and Staff.ServiceRole on the columns. The measure is the calculated measure “Cleaning Hours”:
Cleaning Hours := CALCULATE( SUM ( [Hours] ), dim_Task[ServiceTypeName] = “Cleaning”)
At the intersection of the rows and columns is a cell. The calculated measure is calculated for each cell.
For example, Take the Year 2013 and service role “Field Coordinator” in the pivot table. The cell at the intersection of these two attributes shows 1.26. The cell value is calculated in the following way:
- The current member of the Service Role attribute is set to “Field Coordinator”, filtering the Time Record Fact rows result set to only those associated with Field Coordinators.
- The current member of the Year attribute is set to 2013, further filtering the Time Record Fact rows result set to only those that occurred in 2013.
- Then, the calculated measure in the cell is evaluated. First, the filter is applied dim_Task[ServiceTypeName] = “Cleaning”, again further filtering the Fact row result set to only TimeRecord fact rows for cleaning Tasks, then the measure aggregation (SUM([Hours])) is applied to the Hours column of the TimeRecord Fact table over the remaining rows in the result set, summing Hours to return the result 1.26.
In summary, a calculated measure is calculated for each cell after all the filters on rows, columns, pages and the measure itself are applied.
Further Reading
Below is a list of my favourite books on MDX and DAX.
- Introductory Fast Track to MDX
- Advanced MDX Solutions
- Introductory – Definitive Guide to DAX
- Advanced – DAX Patterns
Advice
I’ve seen implementations try to deliver BI without a semantic layer. They end up building lots of indexes, views, and aggregate tables just to get their solution to perform. They also write complex SQL to emulate calculated measures and hierarchies. These issues are solved out of the box, with a good semantic layer. My advice is to definitely include a semantic layer in your solution, even if it’s unfamiliar to you.