What is a Data Warehouse (and why you need one)
A Data Warehouse is a database that supports enterprise reporting and analysis. A well-designed data warehouse uses accepted data modelling and management techniques to provide an integrated data source that makes it easy to build reports and analyses.
A data warehouse should exhibit the following four characteristics:
- Integrated. A data warehouse takes a copy of the data (on a regular basis) from the enterprise’s application systems. It integrates that data into “one place”, simplifying data access for reporting purposes. A Data warehouse doesn’t capture or create new data itself.
- Subject-oriented, not source system-oriented. A data warehouse reorganises the source data into business subjects/domains, making it easier for users to understand and consume.
- Historical/Time Variant. A Data Warehouse records the history of how data changes. This is important for accurate reporting, auditing and efficient data management.
- Non-Volatile. Data is loaded in periodic “batches”. The data doesn’t change from moment to moment; rather, it’s stable between load periods. This means reporting and analysis can be conducted without the data changing underneath you.
At the heart of a data warehouse is the ability to organize data so end users, report developers, data analysts and data scientists can easily consume it. What do I mean by easily consumed? First, they have a single source of trusted, modelled, easy-to-understand data. Second, users can access that source through BI tools that make it easy to create new reports and analyses or interact directly with the data via code (SQL, R, Python, etc).
You need solid data architecture and modelling techniques to achieve the ideal of “easily consumable data”. The most commonly used architecture and modelling technique is the “Kimball” data warehouse methodology. The Kimball methodology describes:
- A layered data architecture typically comprised of Staging, Transformation, Presentation and Semantic layers.
- A Dimensional data modelling technique that models data in a simple, easy-to-understand “star” schema.
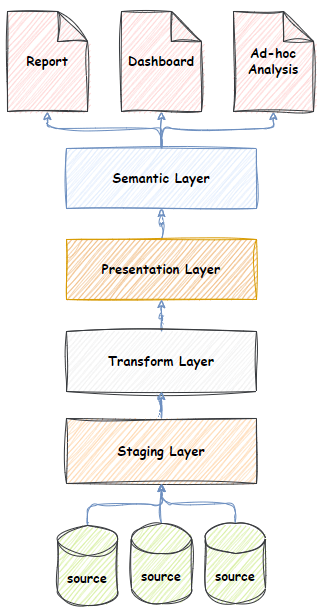
- The staging layer is where data from multiple systems is landed. It implements the first “integration” characteristic described above. I.e. simply having all your data “in one place”. A persistent staging layer is a common variant that also captures the history of change, implementing the third “historical” characteristic.
- The transformation layer is where data begins its journey into a subject-orientated format (the second characteristic). Transformation can be complex, and the transformation layer is where this complexity is implemented. It also supports the reuse of the logic by the presentation layer. In this layer, data from multiple systems is often matched and merged into subject area entities.
- The presentation layer is the final subject-orientated representation of the data (the second subject-orientated characteristic). It is modelled using a strict “star” schema. The star schema is an easy-to-understand data model that is easy to navigate and supports multiple analytic use cases. The star schema is comprised of dimensions and facts and their relationships.
- Typically, the semantic layer is the layer exposed to end users. End users interact with the semantic layer for data analysis and visualization via BI tools like PowerBI or Tableau. A semantic layer is implemented in a technology that facilitates high-performance aggregated queries over large amounts of data. The data model of the semantic layer mirrors the star schema of the presentation layer. It further augments the data model with calculated measures that can’t be created in other technologies. More advanced users like data scientists and advanced data analysts may be granted access to the presentation of transformation layers as needed.
- Extract, Transform, Load (ETL) – ETL is not a layer but rather the logic that moves data between layers. The ETL code extracts data from the source, transforms it into a star schema, and loads it into the presentation layer. ETL is usually executed periodically (daily, weekly, four hourly, etc.) and loads batches of data that have changed in that period. It implements the “non-volatile” characteristic.
An alternate architecture growing in popularity is the data lakehouse. A data lakehouse is a combination of the data lake and data warehouse architectures. The data lakehouse describes Bronze, Silver and Gold layers that correspond to the Staging, Transform and Presentation layers of the Kimball Data Warehouse architecture. This is a vendor lead (databricks) reimagining of the data warehouse implemented on different technologies. Data warehouses have traditionally been developed using database technology, whereas the data lakehouse is born out of the open source big data, file system based (HDFS), and Spark ETL technologies that databricks have commercialized.
Why you need a Data Warehouse
The universal truths of data in every organisation I’ve worked in are:
- Data is messy!
- Someone, somewhere, somehow needs to deal with the mess.
- The best place to deal with the mess is in a centralized data warehouse rather than over hundreds of disparate reports.
The best way to understand the benefits of a data warehouse is to imagine your life as report developer without one.
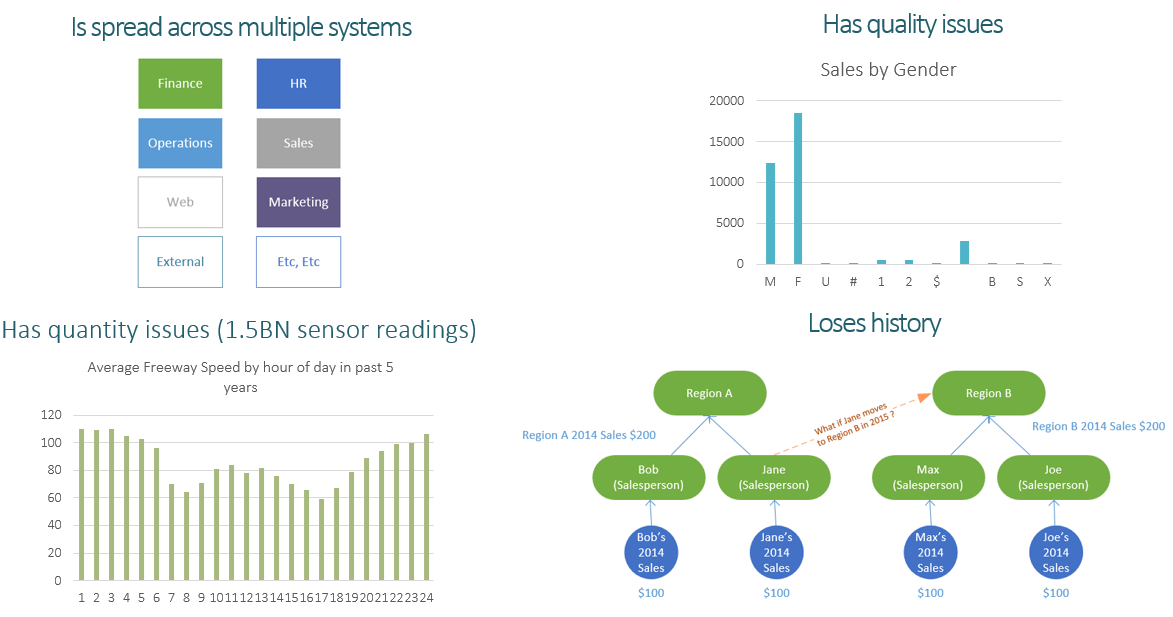
- First, your data is spread across multiple systems, most of which you cannot access.
- Second, the data quality is poor. It’s incomplete, inaccurate, contradictory and not up to date.
- Third, you need to mix, match and merge that data with data from other systems. There may be no obvious or easy way to do that.
- Fourth, the volume of data you need for your report is massive, and the source systems can’t or won’t cope with your query.
- Fifth, the source system doesn’t keep a history of data change, so the reports unexpectedly change for end users.
- Lastly, you use some logic in your report that doesn’t match the logic of someone else’s report, so end users are using and comparing results that don’t match across reports.
Imagine a bunch of developers all creating reports and analysis and solving the same data problems over and over again. It very quickly results in a chaotic and unmaintainable mess.
The situation above is what inspired the development of the data warehouse concept.
The benefits of a data warehouse include:
- Integrating data from multiple sources into a single data store provides easy access to data across business domains. I.e. across financial, HR, operations, sales etc.
- Ability to model data to make it easy to consume. By modelling data in an integrated subject-orientated, easy-to-navigate star schema, data becomes much easier for end users to work with and consume. This leads to the next point – end-user productivity.
- End-User Productivity. In any organization, a subset of people spend part or all of their day producing information in one form or another. Typically, they spend much of their time wrangling messy data. One of the benefits of a data warehouse is end-user productivity. All that data manipulation is already done, and the users can concentrate on analysing and responding to information rather than producing it.
- A single version of the truth. A data warehouse lets you implement the logic for metrics once and then have all reports and analyses use the data warehouse as their source. In that way, there is just a “single version of the truth”. Business users work with agreed definitions for KPIs, metrics and measures.
- Remove load from operational systems. Operational systems are generally tuned to manage hundreds, if not thousands, of small individual transactions. Analytics can require querying millions (even billions) of rows. For example, a total annual sales metric for a large e-commerce platform requires summing across all sales rows in a year. A single analytical query can cause major performance issues for an operational system. Separating reporting and analysis load to a data warehouse removes adverse impacts on operational systems.
- Analyze the past as it existed in the past. For example, imagine a salesperson (let’s call him Gary) works in region A. A regional sales report rolls up the sales figures for Jane into the total for region A. Imagine Jane moving from Region A to Region B. In the report, Jane’s past sales suddenly move from Region A to Region B. Undesirable. A Data Warehouse has modelling methods to prevent this issue. In a data warehouse, historical sales would remain associated with Region A, and only new sales would be attributed to Region B.
- Eliminate Personnel Risk. Business logic is often locked up in spreadsheets or visualizations (Power BI, Tableau, Qlik, etc.) created and managed by individuals. There is a risk that if that individual leaves, no one else is able to manage these sometimes business-critical spreadsheets or reports. Centralizing your business logic (measures, KPIs, etc.) managed by a data warehouse team reduces this risk.
- Data augmentation for reporting purposes. A Data Warehouse can model and augment data specifically for reporting purposes. This augmentation isn’t available in a source system. For example, analytics functions like relative period (e.g. MTD, YTD, etc.), periodic and rolling calendars (e.g. Christmas Period, Public holidays, etc.), the definition of acceptable ranges, targets, KPIs, aggregation or disaggregation of data, and periodic balances (e.g. end of month balances).
- Keep historical data. A data warehouse can capture the history of how data changes. This can assist with accurate reporting and auditing of data and improve load performance. A Data Warehouse can keep historical data beyond the normal retention period of operational systems.