What is a Data Warehouse Bus Matrix? (and why you need one)
A “Data Warehouse Bus Matrix” describes the high-level design of a Data Warehouse. At a glance, it shows all the facts and dimensions of a data warehouse and their relationships in a table-like ‘matrix’. It’s useful as a tool to design, plan, estimate and communicate your data warehouse.
The “Data Warehouse Matrix” comes from the industry-accepted Kimball Data Warehouse methodology. In the Kimball method, practitioners are encouraged to create a “Data Warehouse Bus Matrix” to describe the high-level design of the Data Warehouse.
It should be the first thing a Data Warehouse Architect does to define a Data Warehouse project.
Grab your free Data Warehouse Bus matrix template ->
“I’ve used this Bus Matrix spreadsheet on all my projects to help design, plan and estimate data warehouses and communicate the scope and progress to stakeholders.”
Why do you need a Data Warehouse Matrix?
A Data Warehouse Matrix is a simple yet powerful communication tool. Its simplicity is its core strength, making it useful for communication that works at every level of the organization, from executives to end-users and developers.
A Data Warehouse matrix serves several purposes:
1. Capture Design: Succinctly capture the high-level design of the enterprise-wide data warehouse.
2. Communication: At a glance, communicate the scope, business process coverage and high-level design of the Data Warehouse to stakeholders, developers and end-users.
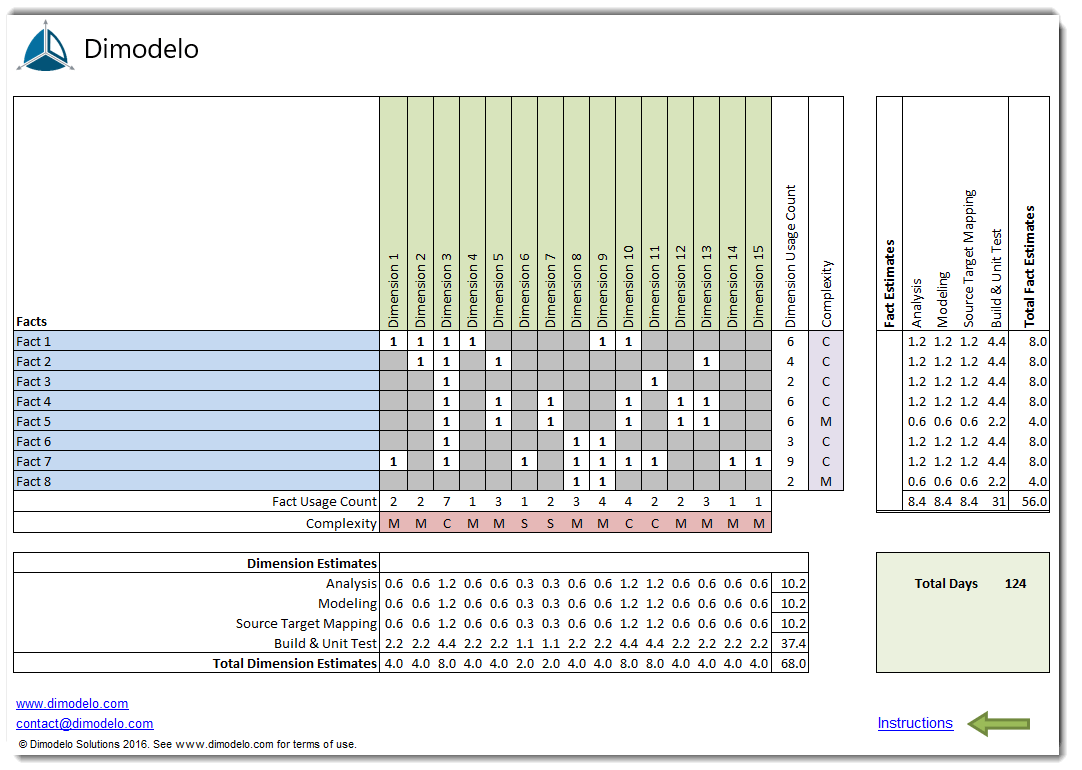
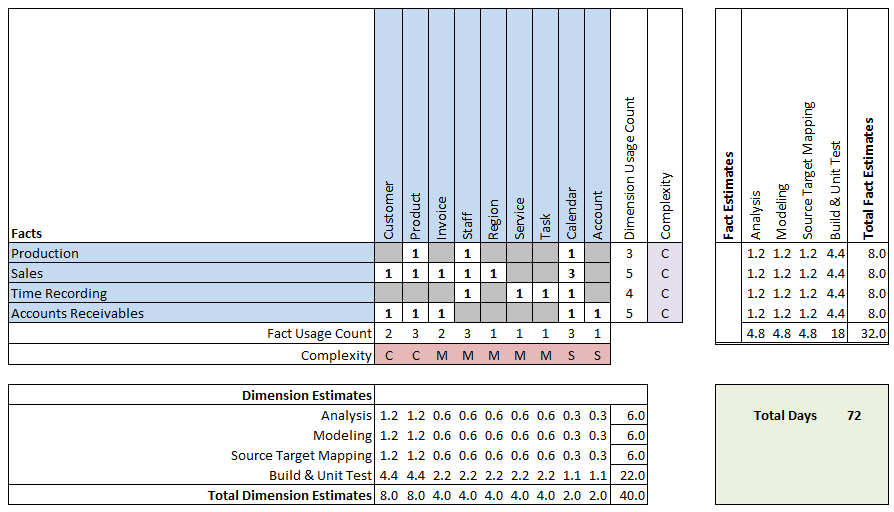
3. Estimate: With a few enhancements, Designers can use the Data Warehouse matrix to estimate the time required to build the Data Warehouse.
4. Plan: Assist in planning the delivery of each development iteration of the project whilst ensuring each iteration conforms to an overall design.
5. Progress: Communicate the progress of the project.
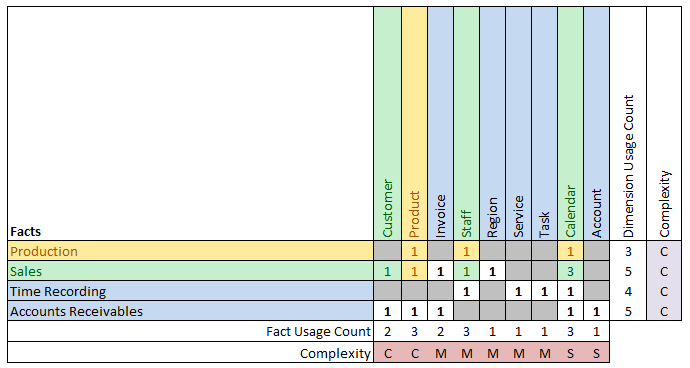
A Data Warehouse Bus Matrix example
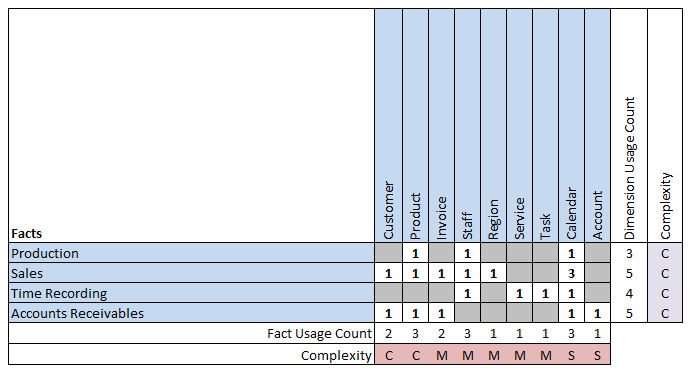
Below is an example of a very simple Data Warehouse Matrix.
On the rows of the Matrix are the Facts/Business Processes (e.g. Sales). On the columns are the Dimensions/Business Entities (e.g. Customer). The cells represent the relationships between the Facts and Dimensions. The number represents how many relationships exist between the Fact and Dimension. An empty cell means there is no relationship.
For example, the “Production” fact below is related to (or “dimensioned by”) the Dimensions Product, Staff and Calendar. This means an end-user can analyze “Production” measures by any combination of the Product, Staff, or Calendar Dimensions attributes.
You will also notice that the Production fact shares the Product, Staff and Calendar dimensions with the Sales fact. When Facts share Dimensions, it’s known as “conformed” dimensions. That is, the facts “conform” to the same set of dimensions. The benefit of conformed dimensions is cross-business process analysis.
For example, the Product and Calendar dimensions shared between the Production and Sales facts mean we can analyze Sales vs Production for any given time period broken down by Product. If Facts share a Dimension, measures of those facts can be analyzed together on the same pivot table when slicing by that Dimension.
The Data Warehouse matrix is a very easy way to communicate the cross-business-process analysis capabilities of a data warehouse.
The matrix can also highlight issues with your design. For example, the matrix above shows the Sales Fact has no relationship with the Account Dimension. Users might have requested to see Sales broken down by Account and compare to current Accounts Receivables for that same Account. The Matrix shows this isn’t possible, and there is a need for an additional relationship between Sales and Account.
Data Warehouse Development Planning and Progress
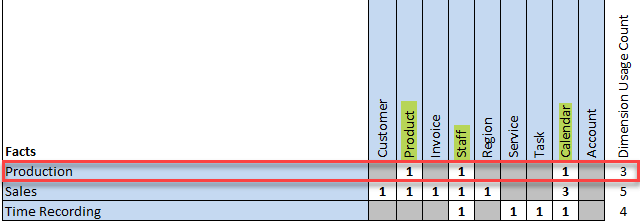
You can use the matrix to help plan your project. Generally, you won’t or can’t deliver the entire Data Warehouse at one time. Having a matrix allows you to deliver parts of the Data Warehouse while still maintaining an overall plan that integrates new Dimensions and Facts as they are created.
Initially, you will make decisions about which Facts are going to be the most valuable and deliver those first. But you will have to temper that decision based on complexity, which is partially determined by how many Dimensions a Fact table is related to.
While the project progresses, you can use colour to communicate project progress.
Continuing on from our previous example, the project has completed its first iteration and is currently working on the second. In the image below, the Bus matrix has been color-coded to communicate status.
- Green = done,
- Yellow = in-progress
- Blue = not started.
In iteration one, the project delivered the Sales fact with some of its dimensions (shown in green). In the current iteration, the project is delivering the Production Fact with a single Product dimension (shown in yellow). Since we are delivering the Product dimension, we are also augmenting the Sales fact with the Product dimension. In this case, the Production fact was considered a quick win since the majority of its Dimensions were already delivered.
Using colour-coding is a simple but effective way of quickly communicating overall progress.
What does a Data Warehouse Matrix communicate?
Depending on the audience, a Data Warehouse matrix can communicate different things. The audience can be broken down into:
- Executives/Project Management
- End Users/Business Analysts
- Developers
Executives/Project Management:
- The scope of the data warehouse.
- The coverage across the value chain and business processes.
- The effort required to complete the Data Warehouse. A Data Warehouse Matrix enhanced with automated estimating can communicate effort to Project Managers for duration and cost Estimation.
- Tracking and communicating progress is possible by adding colour coding to the Data Warehouse matrix.
End Users/Business Analysts:
- How end-user analytics requirements are satisfied by the Data Warehouse.
- How end-user requirements fit within a broader enterprise-wide reporting framework.
- How end-users can analyze a given Fact by a given set of Dimension attributes.
- How conformed dimensions enable integrated reporting across business processes.
Developers:
- A master plan for data warehouse delivery, providing context for current iterations.
- Overall high-level design.
- Progress. Tracking and communicating progress is possible by adding colour coding to the Data Warehouse matrix.